Background
EasyPark's numerous web products are all using different components and guidelines, creating inconsistency and inefficiency. After the Rally Design System team had made good progress with the apps, we were ready to get started on the web side.
Goals
Assist the Rally Design System team by:
Holding workshops to raise awareness and increase involvement.
Gathering data on user behaviour to inform component design.
Testing concepts with customers to help validate component ideas.
Outcomes
Some early outcomes showed:
Reduced
Design debt
Role
Worked together with 4 designers to define the visual direction and ideate on components, representing the interests of B2B teams and customers.
Collaborators
Held workshops with B2B product teams, marketing and sales colleagues to raise awareness and get early feedback.
Audience
Primarily internal teams building web products.
Main tools


Jump to
Problem
Inconsistency and inefficiency
EasyPark’s web products had inconsistent UI and UX patterns, as each team customized components differently. This was a problem because it created design debt, slowed development, and made the user experience inconsistent.
Initial solution
I started to address this problem by building a component library. The goal being to consolidate the wide variety of components into a refined set and to standardize the typography, colors, and spacing. I also documented some best practices for handling errors and UI interactions to support developers.
While this did help improve consistency and reduce design debt, challenges remained as I had limited time and there was no formal process for adoption so development updates were slow.

Discovery
Defining the visual direction
The design system team and I spent a good amount of time doing research on the visual identity and foundational elements of the web design system. Some key research I was involved with was:
Building a moodboard and gathering inspiration – We looked at web design systems and UIs that we liked and brought together different brand elements and guidelines to ensure that the visual identity was cohesive with the app and marketing websites.
Cataloging all EasyPark UI components – We put together an inventory of components across all of EasyPark’s web platforms, helping us understand existing variations and what needed consolidation.
Analyzing screen size data – Something I worked on independantly was data analysis from our B2B self-service platform, revealing a mix of standard office monitors, ultra-wide screens, and significant mobile usage. These insights shaped how we approached responsive design and component scalability.

Collaboration
Stakeholder alignment
While the design system team focused on defining the foundational elements and components, I started gathering early internal feedback and raising awareness of coming changes to our B2B web product.
This involved organizing several workshops with teams working in the B2B space:
Marketing – With a sizable UI change coming, I felt it necessary to align with marketing as they will be integral to raising awareness with customers about what's coming. They also utilizes UI screenshots in a lot of promotional material and guidance articles.
Sales – They often discuss our B2B self-service platform with clients and should be kept updated with changes being made. Also, they have a good understand of how customers feel about the current platform and can help provide insight on how customers might react.
Product and engineering – I helped co-ordinate a broader workshop to introduce product teams in the B2B space to the design system and highlight the benefits it would bring to development.

Testing
Early concept testing
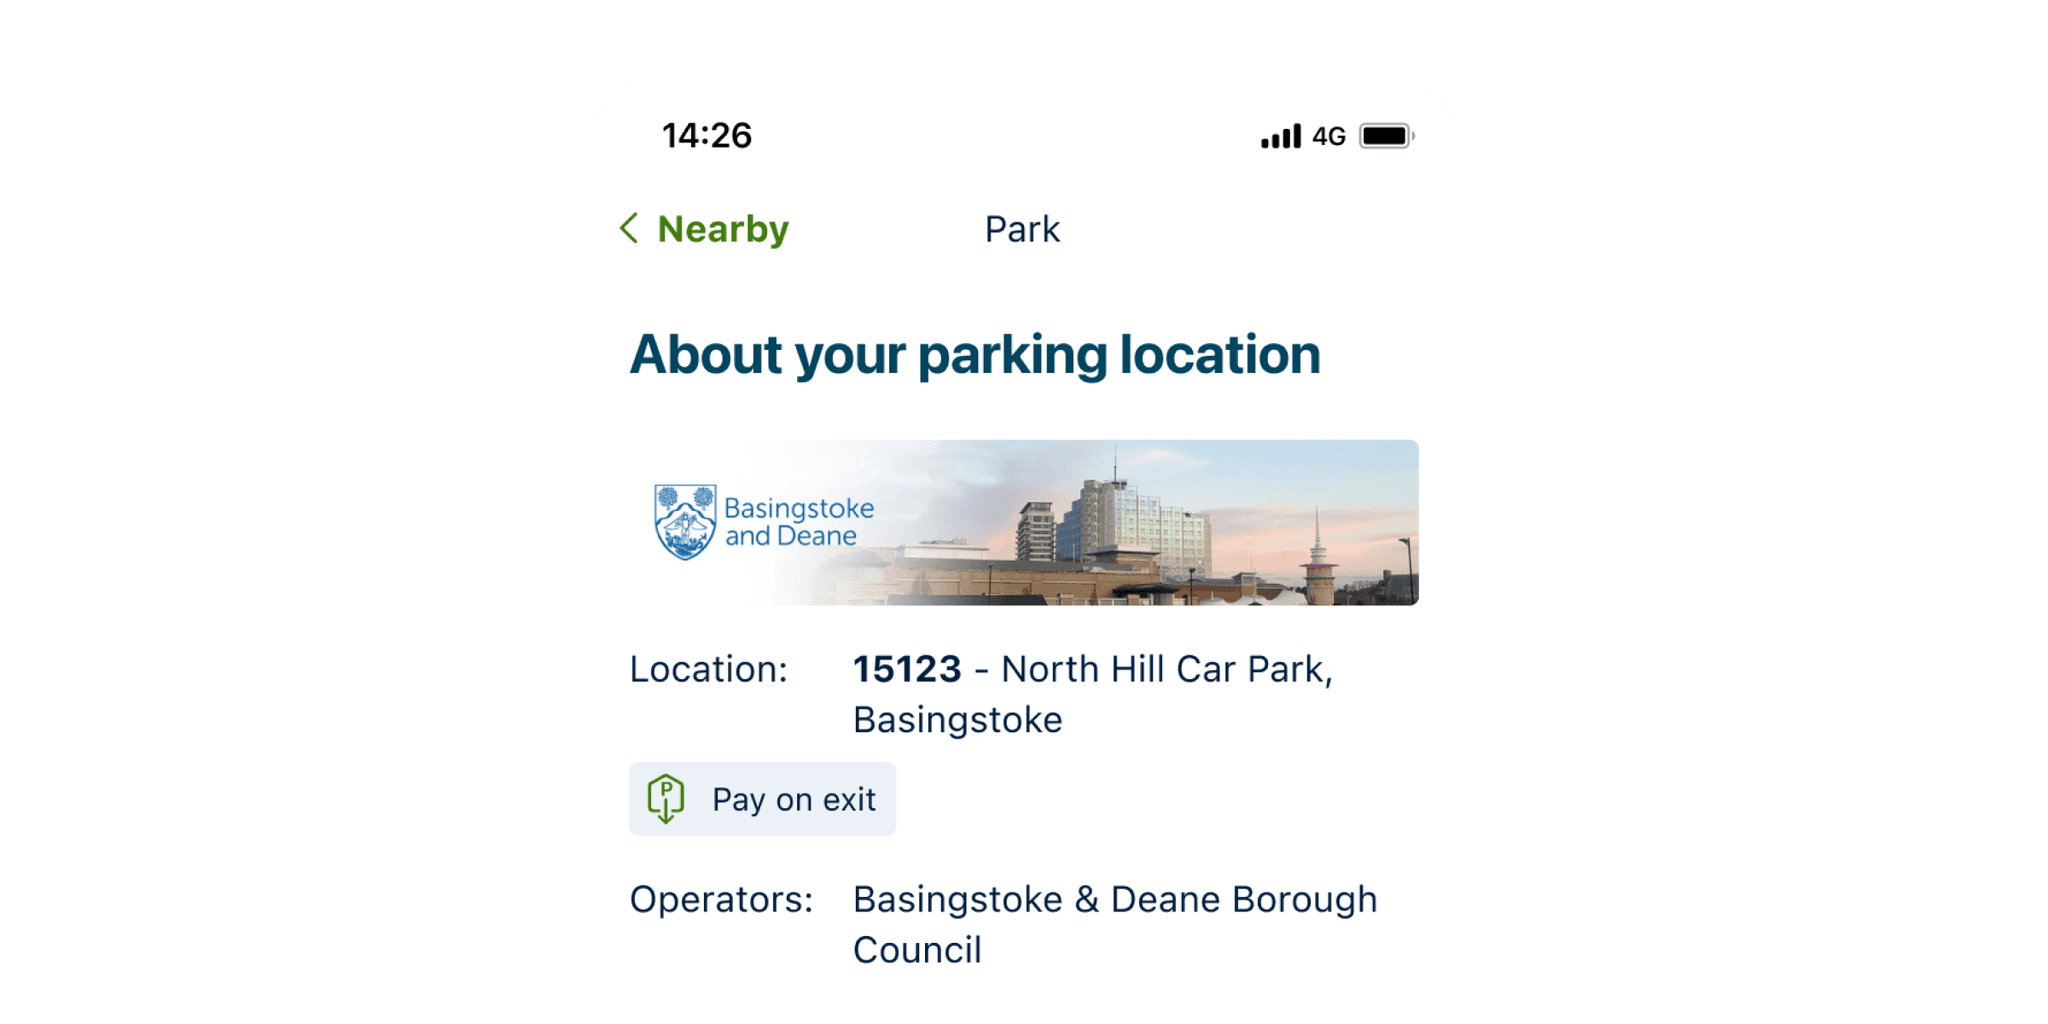
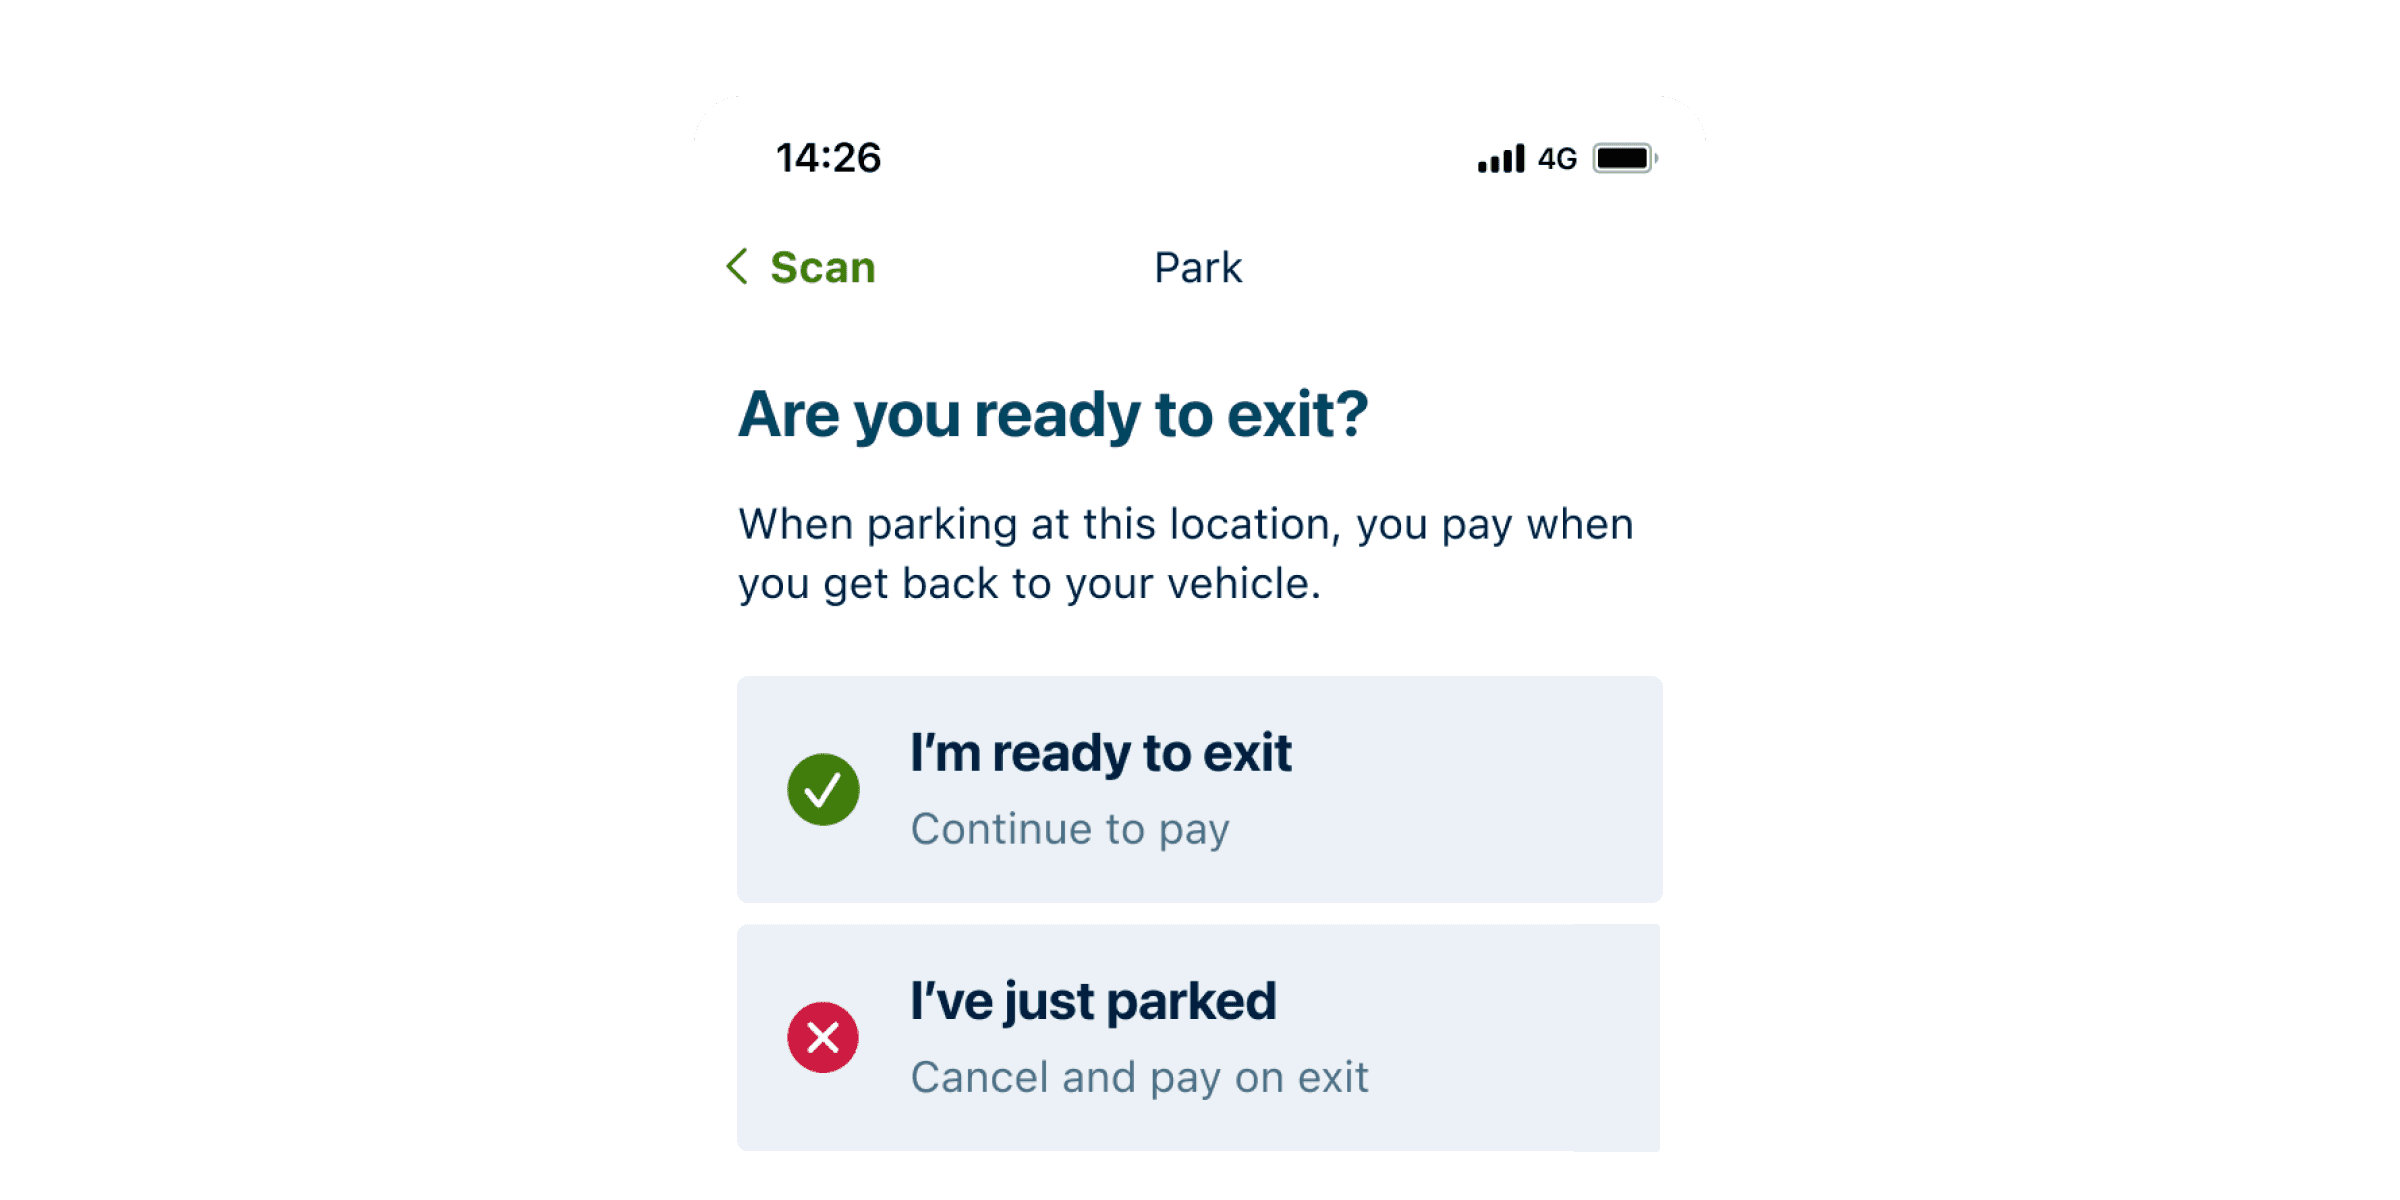
I designed B2B self-service screens using real data and replaced the old components with both conceptual and finished Rally components. This allowed us to validate how components worked in practice and explore alternatives. For example, tables were historically used for all data-heavy pages, but we experimented replacing them with cards or multi-line lists on narrower screens where users prioritized search over scanning large datasets.
Internal feedback
Once we had a number of components refined, I created a prototype of the B2B self-service platform to start gathering internal feedback, first from designers, then from broader stakeholders.
We wanted to use a fill for the tables and initially we used a pale grey fill on white background, but we switched it around after a few people agreed with this comment:
Customer feedback
After making a few initial changes, I collaborated with user research to get some early feedback from existing B2B customers. Our goal was to assess whether users could navigate key workflows with ease and to identify usability pain points.
Feedback from our first tester showed that:
This feedback reassured me that the new design was intuitive, allowing users to focus on their tasks rather than struggling with navigation.

Outcomes
The impact so far
Though the design system was still in progress when I left, its early adoption was already benefiting the B2B self-service platform team:
Increased Figma and code parity – Components designed in Figma had the exact same styling and tokens as the ones visible in Storybook, reducing the need for QA of components with new feature launches.
Reduced story points – We needed to make it possible to switch between different brand color palettes and implementing the design system's color tokens made that project much quicker for the developers.
Faster UI updates – Buttons and text fields from the design system were implemented in a few places and with the ownership of improvements on the design system team, updates could come without the new for the B2B team to shift their focus from elsewhere.
Next steps
The next phase would focus on building additional components and increasing adoption across B2B teams. By continuing to collaborate with product and engineering, the design system could become a fully integrated part of EasyPark’s web ecosystem, ensuring long-term consistency and efficiency.
Based on outcomes from the app design system, we were confident that it would provide huge efficiency benefits for numerous teams across several web products
Learnings
Recruitment B2B testers is tricky
Knowing we needed to test with customers across different markets, we initially worked with Sales to identify and recruit ideal participants, but limited time and scheduling conflicts meant progress was slow.
Just before I left we sought to expand our pool and I felt that I good way to do this could be through using analytical data to identify a much larger group of frequent users. With the help of colleagues from user research and data analytics, we started building a list of potential testing participants to reach out to.